Data Intellect
TorQ provides detailed and thorough standard output, error and usage logging for multiple processes. These comprehensive logs are essential to system development and monitoring. However more detailed logs can increase the time and effort required to examine log files. Logs aggregation can streamline log analysis, by consolidating log data from multiple components or applications into a centralised location. Log aggregation tools provide control over storage and tools to manage, monitor and analyse logs. These tools allow users to analyse and monitor logs in real time, via searching, filtering, grouping, or creating alerts. They provide overview of an application’s status and improve support team or developers’ efficiency in using logs to monitor system activity and troubleshoot.
TorQ logs can be integrated and aggregated with Google Cloud Platform (GCP) logging tools. We have covered using TorQ in GCP in a previous blog post.
Importing TorQ logs to GCP
The logging agent must be installed to use GCP Logging with your Virtual Machine (VM), regardless of whether TorQ is deployed or not. By default, the agent will regularly check and import certain logs, using a set of configuration files as guides.
Logging Agent
A guide to installing the Cloud Logging Agent can be found here: Installing the Cloud Logging agent on individual VMs | Google Cloud
By default, GCP virtual machines do not have the necessary GCP logging agent preinstalled. Run the following commands within the VM to install the latest version of the agent:
curl -sSO https://dl.google.com/cloudagents/add-logging-agent-repo.sh
sudo bash add-logging-agent-repo.sh --also-install
Configuration Files
The /etc/google-fluentd/config.d folder is created during logging agent installation and contains configuration files for all logs actively being checked by the agent. These files follow the same general format, outlining the corresponding log’s location, type and content structure (if applicable).
Logs can be split into two major groups: unstructured, which do not organize log data according to a set schema, and structured, which do.
Paths to logs can point to specific log files or directories containing logs. Wildcards (*) may be used here.
Unstructured Logs
Unstructured logs are treated the same regardless of the content. Each line is imported as a text block. Imported unstructured log entries are found under the ‘textPayload’ key within corresponding Logs Exporer entries.
We can import unstructured logs by adding the following to a configuration file (from GCP Cloud Logging documentation).
<source>    @type tail
    <parse>
        # 'none' indicates the log is unstructured (text).
        @type none
    </parse>
    # The path of the log file.
    path /path/to/unstructuredlog
    # The path of the position file that records where in the log file
    # we have processed already. This is useful when the agent
    # restarts.
    pos_file /var/lib/google-fluentd/pos/unstructuredlog.pos
    read_from_head true
    # The log tag for this log input.
    tag unstructured-log
</source>
Structured Logs
Structured logs are handled differently depending on the structure of their entries. The agent will parse log entries and import them as queryable JSON objects. Depending on entry format, a custom parser may be needed in order to translate entries into JSON.
We can import structured JSON logs by adding the following to a configuration file. Notice that we now specify a type.
sudo tee /etc/google-fluentd/config.d/test-structured-log.conf <<EOF
<source>
    @type tail
    <parse>
        # 'json' indicates the log is structured (JSON).
        @type json
    </parse>
    # The path of the log file.
    path /path/to/structuredlog
    # The path of the position file that records where in the log file
    # we have processed already. This is useful when the agent
    # restarts.
    pos_file /var/lib/google-fluentd/pos/structuredlog.pos
    read_from_head true
    # The log tag for this log input.
    tag structured-log
</source>
For logs that are not JSON formatted, such as TorQ logs, the configuration file is slightly different. A custom parser, which uses a regular expression, is required to read the contents. Name capture groups are used to assign a key to each value in a log entry. For pipe delimited TorQ usage logs, we add the following to our configuration fies.
<source> @type tail # Format indicates the log should be translated from text to # structured (JSON) with three fields, "action", "thing" and "cost", # using the following regex: format /(?<timestamp>.*)|(?<id>.*)|(?<timer>.*)|(?<zcmd>`.*)|(?<proctype>`.*)|(?<procname>`.*)|(?<status>".*")|(<a>.*)|(?<u>`.*)|(?<w>.*)|(?<cmd>".*")|(?<mem>.*)|(?<sz>.*)|(?<error>".*")/ # The path of the log file. path /path/to/usage/log # The path of the position file that records where in the log file # we have processed already. This is useful when the agent # restarts. pos_file /var/lib/google-fluentd/pos/usage-structured-log.pos read_from_head true # The log tag for this log input. tag usage-structured-log
</source>
All log files fitting the specified format will be imported, regardless of which parser is used.
Restarting the Agent
Once all of the necessary configuration files are in place, the logging agent must be restarted in order to pick them up. Execute the following command on your VM:
$ sudo service google-fluentd restart
The agent should now pick up changes to your log files automatically and you should begin to see your log entries filling the “Query results” section at the bottom. Log entries are returned based on what’s given in “Query”. By default, an empty query is submitted when you open the Logs Explorer and all log entries are returned.
GCP Logging Tools
Google documentation describes their Cloud Logging as a, “fully managed service that allows you to store, search, analyse, monitor, and alert on logging data and events from Google Cloud and Amazon Web Services. You can collect logging data from over 150 common application components, on-premises systems, and hybrid cloud systems.” Cloud Logging documentation | Google Cloud
Logs are stored in log buckets which can be accessed, queried and managed through the Logs Explorer user interface or programmatically through the Cloud Logging API. The example of using GCP logging with TorQ logs in this blog was completed using the Logs Explorer User Interface and not the API. Details on the API are available here – Introduction to the Cloud Logging API v2 | Google Cloud
The Log Explorer Interface
The GCP Logs Explorer is a versatile interface that simplifies working with logs. Here you can query log entries, create alerts, visualize log volumes and more. Below is a breakdown of the interface, for a detailed guide on the log explorer follow link under the image.
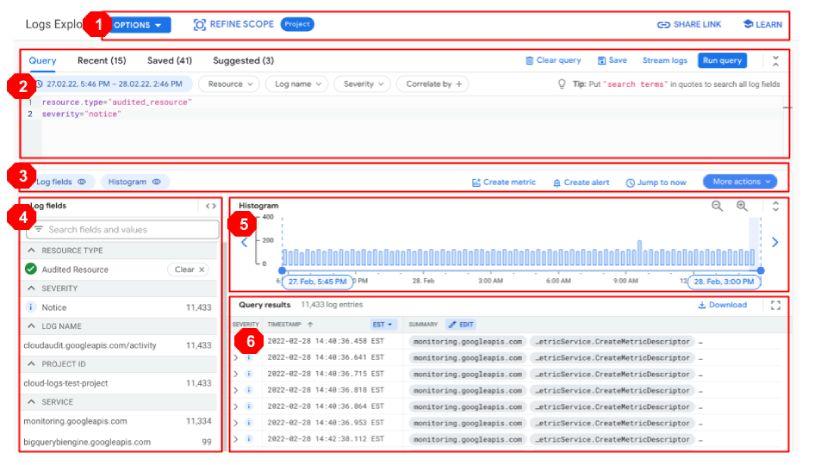
- Action Tool Bar – Refine the scope of your log search, restrict the time-range of query results, easily share your query results, easily navigate to documentation and topics, send feedback and get an overview of new logging features.
- Query Pane – Build, save and run log queries, using the logging query language. Additionally, you can see your recent and suggested queries and use drop-down menus to help you build queries.
- Results toolbar – Quickly show or hide different panes in the interface. Create alerts and metrics. Perform a refresh to include query results up to current time.
- Log fields pane – General overview of log data.
- Histogram – Visualize the distribution of logs over time, helping spot trends in log data and identify problems. Can adjust time range of logs visualised. Log messages are depicted in different colours depending on severity- blue for low severity, yellow for medium severity and red for high severity.
- Query results pane – Log entries that match your query and specified time range are returned.
Querying Logs
Queries filter log entries based on source and/or content. Queries follow a basic key-value format and can be stacked on top of each other. This gives users the ability to be extremely specific in their search. Here is a simple example of a query from the google query language documentation:
resource.type = "gce_instance" AND
       severity >= ERROR AND
      NOT textPayload:robot
This query will return Compute Engine “gce_instance” logs, where the severity is of at least level ERROR and it’s textPayload does not contain the string robot.
Note that the key (field) is a combination of a general field, “resource”, and a subfield, “type”. Values are given as strings. From this example alone we can see the Query Language uses logical AND/OR operators, comparison operators such as =,>,> etc. and a NOT operator. It is possible to use regular expressions with the language and optimise queries by reducing the number of logs, entries and timespan of your query. There is a significant amount to the Log Query Language, an in-depth guide to the Logging Query Language can be found here – Logging query language | Google Cloud .
Alerts
Log-based alerts are a great asset to system monitoring. GCP logging provides the functionality to create, test, edit and delete alerts, based on the contents of your logs, using the Logs Explorer in the Google Cloud Console and Cloud Monitoring API. These alerts are based on the contents of your log. Information on alerts can be found here – Managing log-based alerts | Cloud Logging | Google Cloud
TorQ Logging integrated with GCP
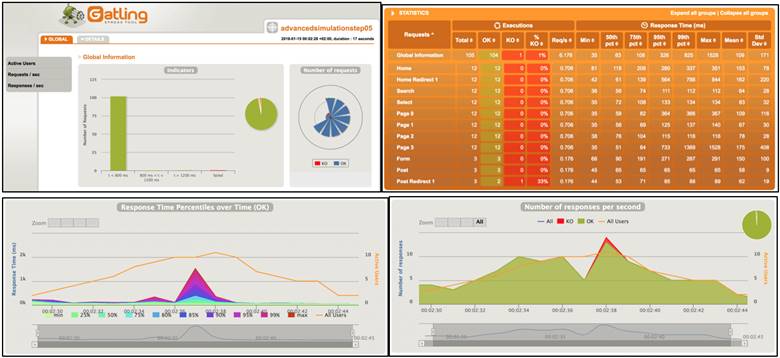
For this example, a TorQ stack was started and the standard output, usage and error logs for the Real Time Database (RDB) were imported for a demonstration. The figure below depicts the log explorer. In the log fields section, we see that there are log messages of differing severities from the VM instance where the TorQ stack is running, with the majority being low severity default messages.
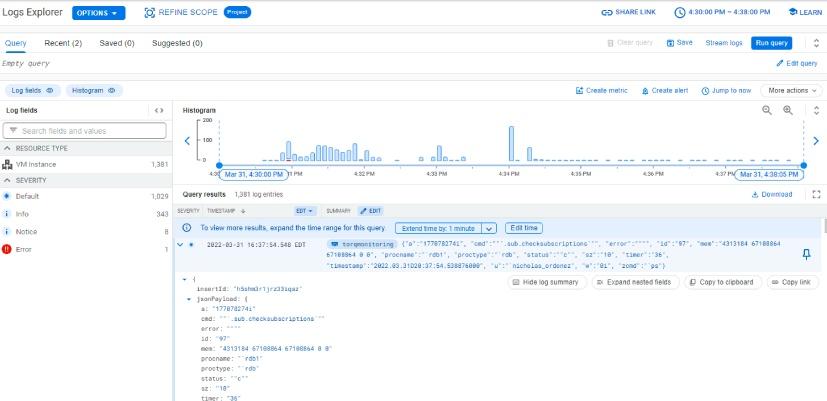
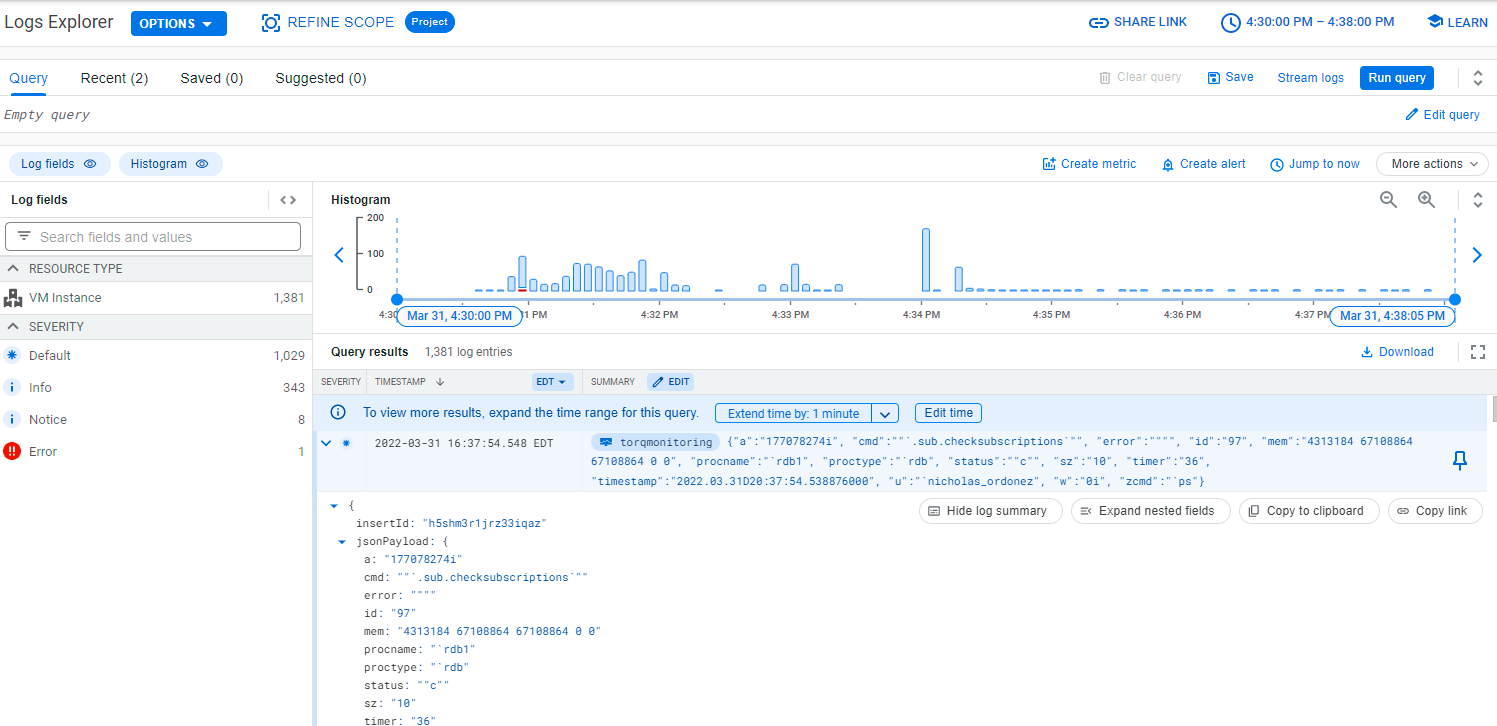
The following image, shows a simple query being executed, filtering by resource and log name. From this example query, the standard output logs from the TorQ stack over the last hour are returned in the Query results pane and visually represented in the Histogram. The query results pane shows the log timestamp, severity and a summary of the log message. Further details can be retrieved by expanding results, shown in the final image.
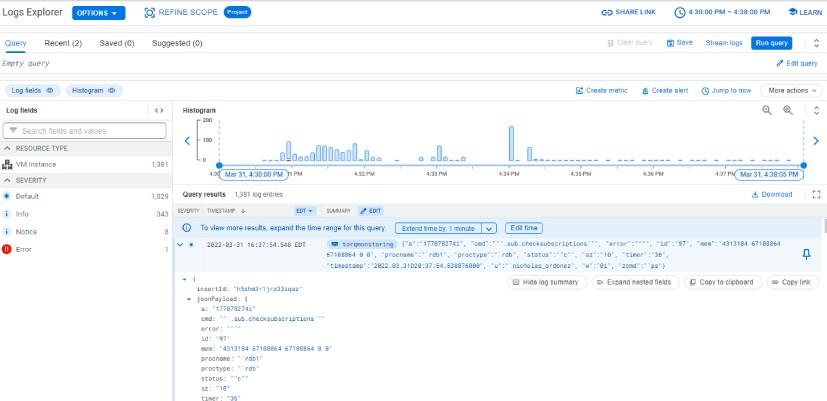
This final image, shows the first result in the Query results pane being expanded, showing the full structured log in JSON format, allowing users to see important information contained in the log message. The content shown when results are expanded will vary depending on the content of the log message. In this example, we can see the process name and type and command executed etc.
This example shows some of the advantages of using GCP logging tools for log aggregation. The ability to:
- filter all log entries in a single location with queries and expand results to see granular detail;
- visualise log data with the Histogram to see when logging density is highest and quickly identify errors or critical issues with the colouring of log messages;
- create alerts, whether scheduled or event-driven based on log message contents or counts derived from log metrics
are all greatly beneficial tools in helping monitor a system and quickly troubleshoot problems.
If you are working with TorQ, we welcome your feedback for future development so please get in touch!
Share this: