Identifying Japanese Candle Sticks using Python
Data Intellect
Introduction
Japanese Candlesticks are a type of price chart that shows the Open, High, Low and Close (OHLC) prices for a security during a specific time-period.
In-and-of-themselves, they show just that, OHLC for a security. However, when adjacent candlesticks are combined together into a single pattern, then market participants can detect trading patterns to help them better time market entry and exit, for example correctly judging when a market is reversing.
This blog post is in 3 parts
- First a simple explanation of what is a candle stick, the information it conveys and the market sentiment they infer.
- Second, some python code is presented that shows how to detect 2 simple candle stick patterns, the Morning Star and the Engulfing patterns. We test these functions using 8 months of SP500- index data to see if we can correctly predict the bottoming out of the SP500 during the initial COVID-19 outbreak in early 2020.
- Finally, the accompanying Github repo comes with a simple Flask App that detects the presence of number patterns on a single trading day in any stock that is a constituent of the SP500 index.
Supporting Python Code
Supporting material containing flask app, jupyter notebooks and sample data files for this post can be found here
What are Japanese Candle Sticks
A candle stick pattern is a method of reading a price chart. They are a visual aid to showing the OHLC of an arbitrary security during a trading session. The duration of a session is also arbitrary, for example it could be an hour, a day, a week, a month etc.
Japanese Candlestick patters were popularised in the west in the 1990s and are amongst the most common techniques used by traders and financial professionals as part of an activity often referred to as technical analysis. They are used by analysts to help identify trading opportunities and better judge how to position themselves in markets.
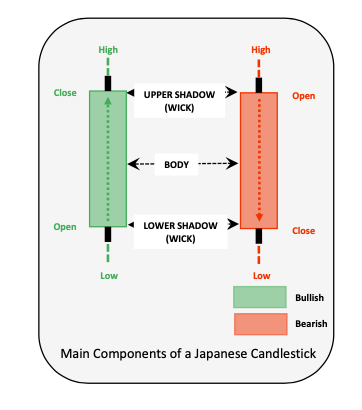
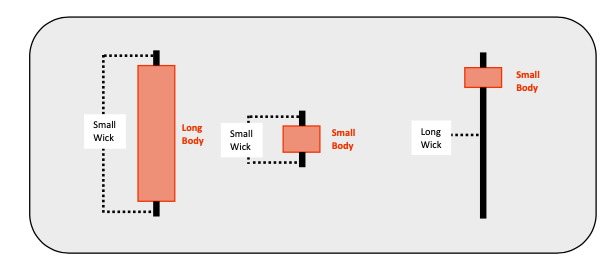
- Green – the price has closed higher than the open, often called bullish.
- Red – the price has closed lower than the open, often called bearish
- The thin black line at either end of the candles body is the wick – this shows the intraday highs and lows.
- For a bullish bar, the open is lower than the close, for a bearish bar, the open is higher than the close.
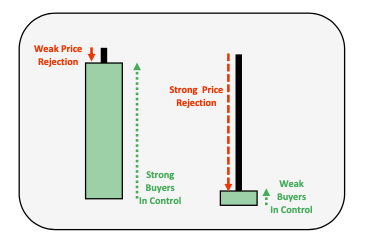
In the above case, the left candle stick is showing a weak form of price rejection, there was some selling but ultimately the buyers were in control of the price, pushing it higher.
The right candle is more interesting, here, the size of the wick relative to the body is large. During this trading session the price would have risen to its high and then dramatically dropped to finally close not much higher than it opened. In this scenario, a lot of selling would have driven the price down from its intraday high.
Some variations of candle stick patterns
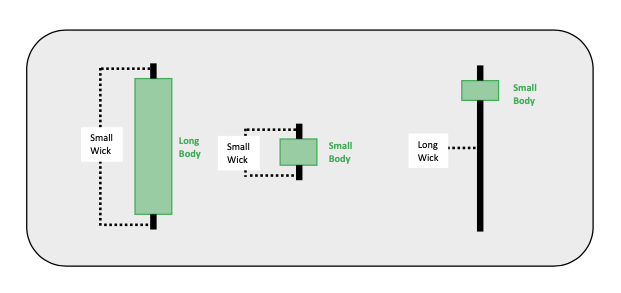
For the candle sticks above, they are all bullish (prices rose during the session)
- Left – quite normal
- Middle – Indicates indecision in the market – small body and small wick
- Right – Buyers driving prices up.
A bearish version of the previous patterns.
Combining Candle Stick Patterns
Consecutive candlesticks are often combined and used to gain more insight into market behaviour.
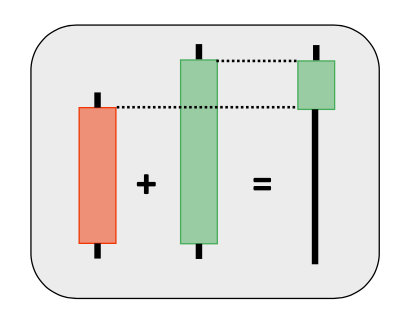
For example, in the combination above,
- in the first trading session, the market was bearish, prices dropped
- in the very next trading session, the market was extremely bullish and finished higher than the previous sessions close.
By combining these 2 candlesticks into a single chart, we can see the overall behaviour of the market during both sessions combined. A trader might reasonably infer that the market had a bullish behaviour, the market rejected lower prices and prices rose.
2 Common Candle Stick Patterns
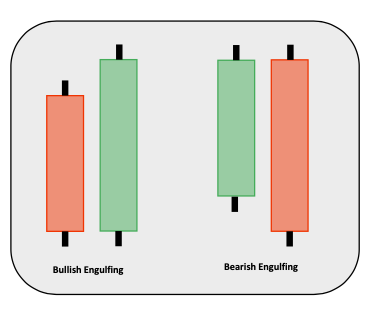
Engulfing
- Bearish followed by a bullish, or vice versa. The second candle engulfs the previous candle.
- 1st candle – sellers in control
- 2nd candle – buyers reversed selling
- But combined together are a bullish pattern.
- Engulfing patterns are an indication of a market reversal.
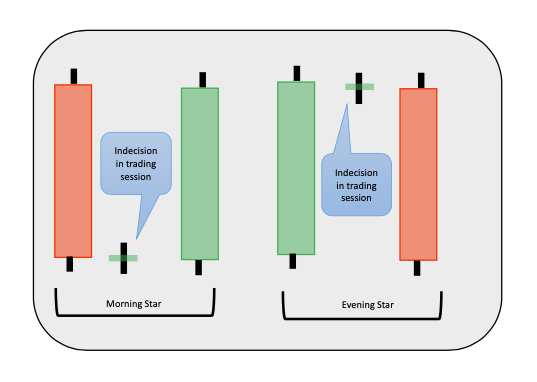
Morning Star & Evening Star
This final pattern spans three trading sessions
- 1st candle – sellers in control – price drops
- 2nd candle – indecision, not much of a body and weak trading both in buy and sell sides
- 3rd candle – buyers in control – price rises
Morning stars are bullish reversal patterns, evening stars are bearish reversal patterns
Python and the TA-Lib package
TA-Lib https://mrjbq7.github.io/ta-lib/ is an open source python library that can be used in the analysis of stock market data and is used to calculate many commonly used performance indicators. Some of these indicators are the results of simple time series calculations such as moving average, momentum, RSI and the like. However, some of the functionality in TA-Lib finds bullish and bearish candle stick patterns.
The full list of candlestick patterns that TA-Lib can identify are here https://mrjbq7.github.io/ta-lib/func_groups/pattern_recognition.html
This post will demonstrate 2 patterns, the Morning Star and the Engulfing pattern.
Install TA-Lib
Standard pip install – tho check the TA-Lib repo for more advanced options how to build and install.
$ pip install TA-Lib
Import libraries
import talib
import yfinance as yf
import pandas as pd
Down load Some data.
The pattern detection component of TA-Lib needs time series data with Open, High, Low and Close columns. This ticker ^GSPC is yahoos symbol for the SP500 index
start_ = "2020-01-01"
end_   = "2020-08-01"

df = yf.download(tickers="^GSPC", start=start_, end=end_)
A plot of the closing prices for this timeseries
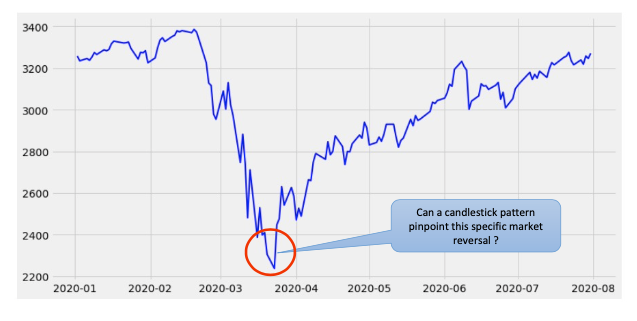
The large drop in this index resulted from the global shutdown following the COVID-19 pandemic.
The more interesting question is could we use Japanese candlesticks to predict the reversal that occurred around the end of march shown below.
The TA-Lib package provides functions for the presence of specific patterns. These functions take vectors of open, high, low and close as parameters and return either
- -100 a bearish pattern was detected on a specific time span
- 100 – a bullish patter was detected on a specific time span
- 0 – no pattern was detected on a specific time span
The function to find morning start patterns is
CDLMORNINGSTAR(open, high, low, close)
Give it an OHLC time series of and it will return a corresponding time series of -100, 0 or 100.
score = talib.CDLMORNINGSTAR(df['Open'], df['High'], df['Low'], df['Adj Close'])

# Returns a lot of ZEROS
print(score)
Output
Date
2020-01-02    0
2020-01-03    0
2020-01-06    0
2020-01-07    0
2020-01-08    0
             ..
2020-07-27    0
2020-07-28    0
2020-07-29    0
2020-07-30    0
2020-07-31    0
Length: 147, dtype: int32
To filter for dates when the score was not Zero.
# Filter wherre score not equal to Zero
print(score[score != 0])
Output
Date
2020-03-24    100
dtype: int32
Returns only the date 24th March 2020 – the date of the market reversal.
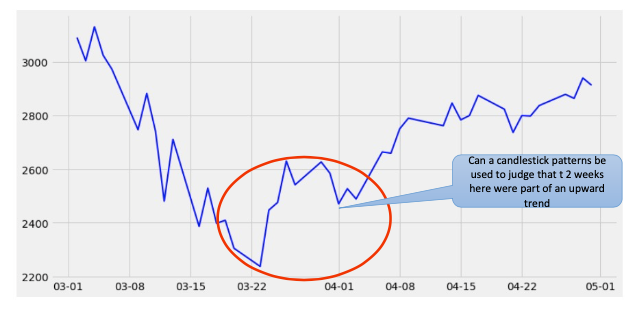
Not bad, it seems to have correctly identified the market reversal and identified an opportune time to enter the market.
Out of the entire time range, there was only 1 signal for a Morning Star, it was a bullish reversal pattern, meaning its was a good indicator that the market was reversing.
A cautious investor might seek to reinforce this finding by getting a second opinion from another Candlestick, for example, a Bullish Engulfing pattern shortly after the Morning Star. That would be 2 different bullish candle sticks in quick succession.
To find all engulfing patterns in the date range
score = talib.CDLENGULFING(df['Open'], df['High'], df['Low'], df['Adj Close'])

# Filter wherre score not equal to Zero
print(score[score != 0])
Output
Date
2020-01-10   -100
2020-01-15    100
2020-01-24   -100
2020-02-10    100
2020-03-20   -100
2020-04-02    100
2020-05-12   -100
2020-06-19   -100
2020-07-09   -100
2020-07-22    100
dtype: int32
And the cautious investor would see that on 2nd April, a second bullish pattern was found giving them more confidence that the market was indeed in a bullish reversal.
Obviously these do not mean that markets are going to move in a particular direction, they are indicators, used with other indicators.
A simple web app.
The final part of this blog describes a very simple Flask web application that
- downloads market data for any ticker in the SP500
- allows a user to choose a candle stick they are interested in (any of the patterns in TA-Lib)
- scan ALL market data for all tickers in the data set
- makes a web call to the finviz website https://finviz.com/ to have the chart displayed along with some simple green / red styling.
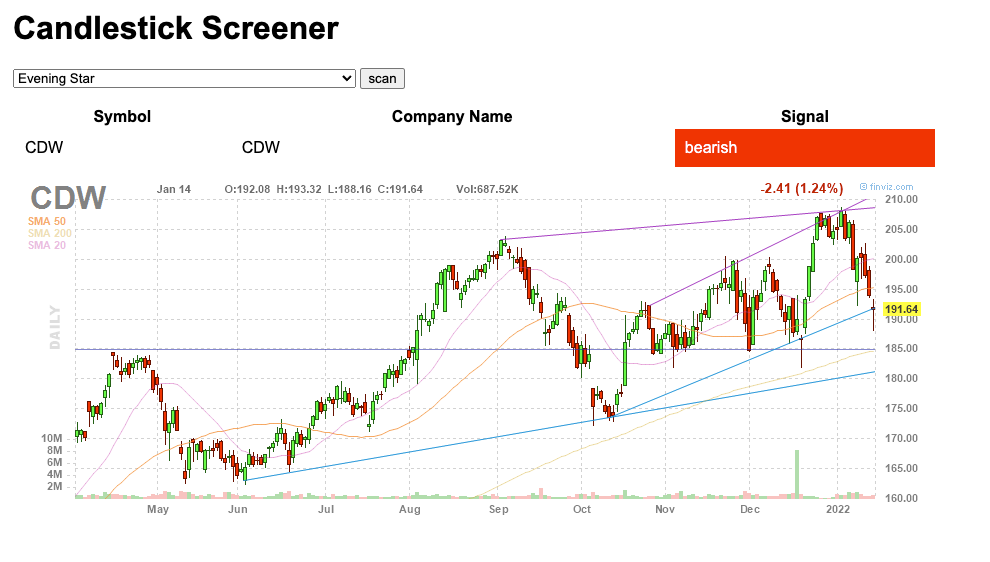
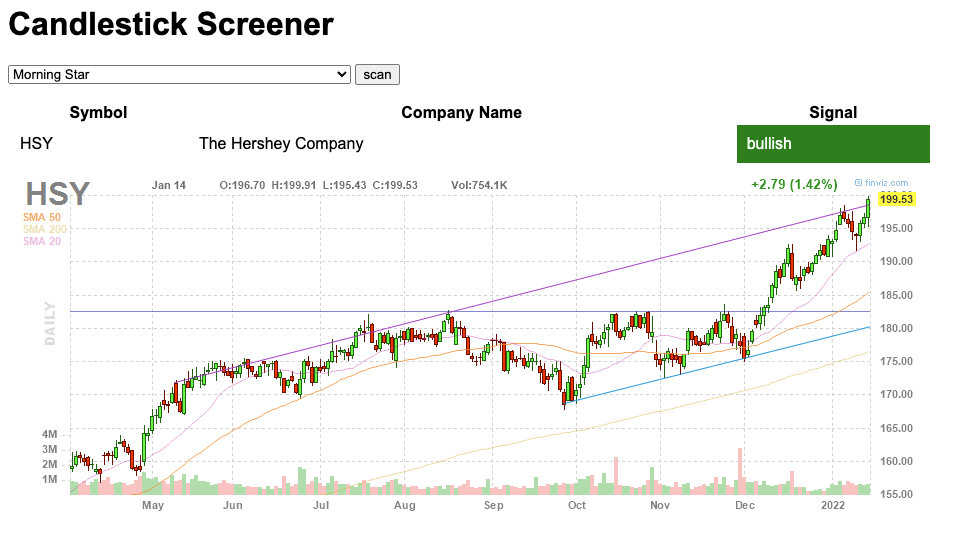
For Example
Scan for Evening Star finds a bearish pattern in last day of trading in CDW
Scan for Mornign Star finds a bullish HSY
Code Structure
The screen markup, styling etc is contained in the file Templates/Index.html.
The application has 2 endpoints, implemented in the file app.py
Snapshot.
E.g. localhost:5000/snapshot
Downloads a year’s worth of market data for every ticker in the file sp500.csv.
To see one way to find these tickers see the accompanying Jupyter notebook
The default end point
E.g localhost:5000/
- It populates a dropdown with all candlestick patters available in TA-Lib.
- It then scans each of the downloaded csv files searching for the pattern in the last trading day only.
- If any are found it makes a call to the finviz website to have a chart drawn for the ticker in question.
Conclusion
This is a simple introduction to Japanese Candle sticks and what information they contain. It then showed how these can be combined so that investors to better understand market behaviour and make more informed timing decisions. It showed how to incorporate candle sticks into a python application to judge a market reversal and finally presented a simple flask application to interactively scan a portfolio of securities for specific candle sticks on a single session.
Share this: