Real-time airline traffic dashboards with TorQ-Air
Data Intellect
TorQ-Air is an application built on the TorQ framework that allows us to capture data through the Lufthansa developer API and perform both real-time and historical analytics on flight data. The solution includes a front-end built on Kx-dashboards, showing a number of real-time and historical stats. Download and installation instructions can be found on the TorQ-Air github repo.
Founded in 1953, Lufthansa is Germany’s largest airline and the fourth largest worldwide by revenue[1], giving us a lot of data with which to work our magic. In general the airline industry runs on paper-thin margins, with Lufthansa and EasyJet sporting a 3{e673f69332cd905c29729b47ae3366d39dce868d0ab3fb1859a79a424737f2bd}[2] and 6{e673f69332cd905c29729b47ae3366d39dce868d0ab3fb1859a79a424737f2bd}[3] net profit margin respectively for the 2019 financial year. Compare this to consumer firms like Coca-Cola pulling in a cool 23{e673f69332cd905c29729b47ae3366d39dce868d0ab3fb1859a79a424737f2bd}[4] net profit margin over the same period. Airlines also generate vast quantities of data on each and every flight[5]. This combination of traits means that data related insights on how to manage an airline are all the more valuable. In this post we’ll give a bird’s-eye view of how we constructed our data capture system and tease out some insights from the data.
Data structure
The Lufthansa Developer API allows us to collect a variety of data, including airport departures and arrivals, flight status and reference data about specific aircraft or airports.
One challenge we faced with the data is that the API has no feature to only request changes in the dataset. To solve this we implemented a cache on the feed handler to ensure that we weren’t recording vast amounts of duplicate data, but at the same time send updates when the status of a flight changes.
After processing the response we get the following columns in our flights table:
| time | Time the flight was captured by TorQ-Air |
| sym | Airline (2 letter IATA code) |
| depAirport | Departure Airport (3 letter IATA code) |
| depTime | Departure time |
| arivTime | Arrival time |
| arivAirport | Arrival Airport (3 letter IATA code) |
| flightNumber | The number on your ticket (e.g. LH452 ) |
| aircraftType | Aircraft Model |
| registration | Tail number unique to each aircraft |
| status | Current status of flight |
We can pull from the RDB the flight records of the plane with the registration “DABGQ” below:
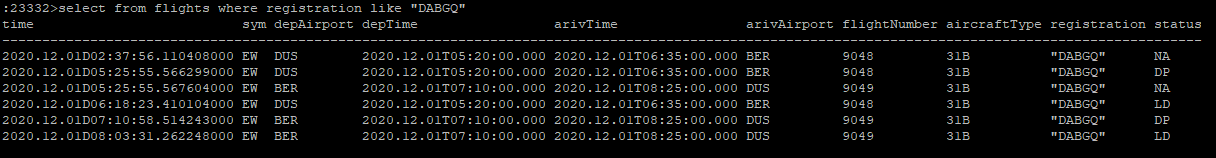
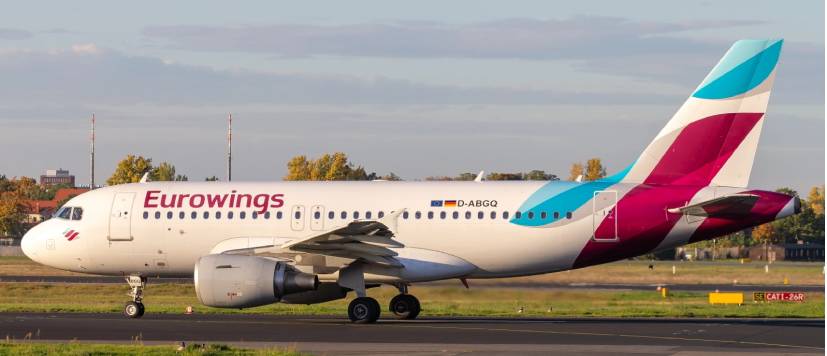
From this we can follow its progress backwards and forwards from Düsseldorf to Berlin over the course of a day. Also note the change in status. NA usually means the flight has just been added, DP means departed, and LD means landed. Here is a picture of it:
Architecture
The back-end of this project acts as an add-on to TorQ, AquaQ’s kdb+ production framework. Mapped out it looks something like this:
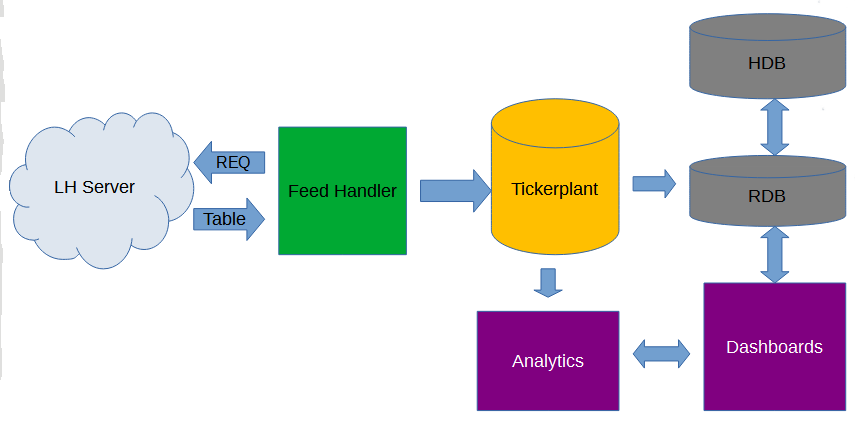
| Feed Handler | Requests departures and arrivals data from configured airports from the Lufthansa servers using the reQ library. Filters duplicate data. |
||
| Analytics Subscriber | Performs back-end calculations which are passed through to our Kx dashboards process |
||
| Dashboards | Front-end process. We’ll see more of this in the next section |
||
| Tickerplant | Standard TorQ tickerplant for disaster recovery and logging |
||
| RDB | Real-time database, TorQ implementation | ||
| HDB | Historical database, TorQ implementation |
Dashboards
We also have a number of dashboards displaying different types of analytics. In the first we have virtual departure and arrival boards of all of the airports that Lufthansa serve, accessed by clicking them on the interactive map, colour coded by flights activity throughout the day. This dashboard also calculates real-time statistics by polling our RDB and HDB on a regular basis, such as the percentage of flight traffic which has passed through this airport today and the most common routes to and from this airport.
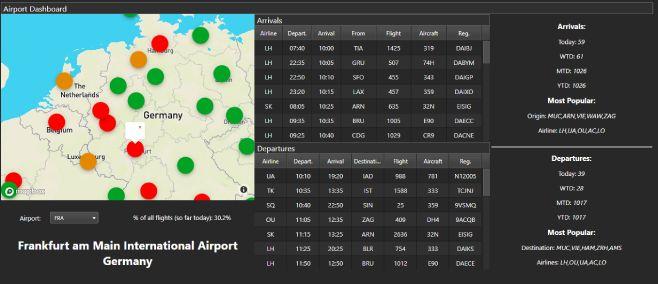
The airport dashboard is useful in identifying Lufthansa’s main hotspots, and identifying changes in the dominance of certain airports over time. Frankfurt often varies from 30{e673f69332cd905c29729b47ae3366d39dce868d0ab3fb1859a79a424737f2bd} to nearly 50{e673f69332cd905c29729b47ae3366d39dce868d0ab3fb1859a79a424737f2bd} of all Lufthansa flights on a given day. In our Routes dashboard we can look at all air traffic between any two airports. In this case we’ll look at Frankfurt and Munich, one of their most heavily trafficked routes.
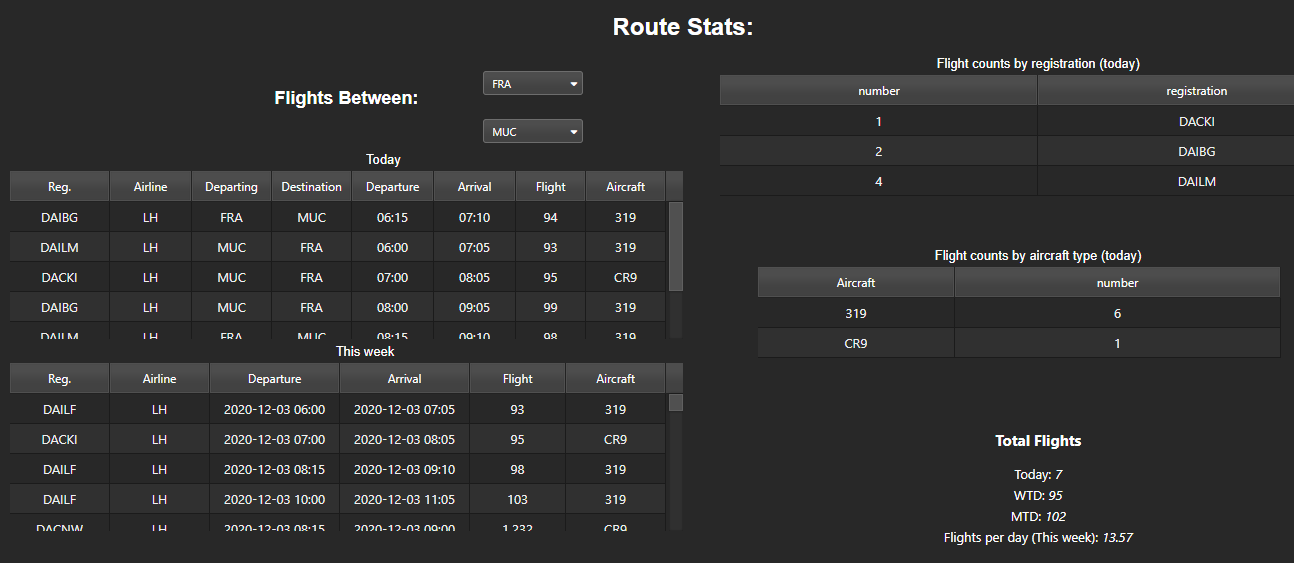
This dashboard can be used to judge passenger volumes for a specific route and how that varies over the course of the week, as we’ll see later on. This can also be used to see which planes are most commonly flying this route, as well as the average flights per day. We also have the Lufthansa dashboard below, which gives an overview of their operations.
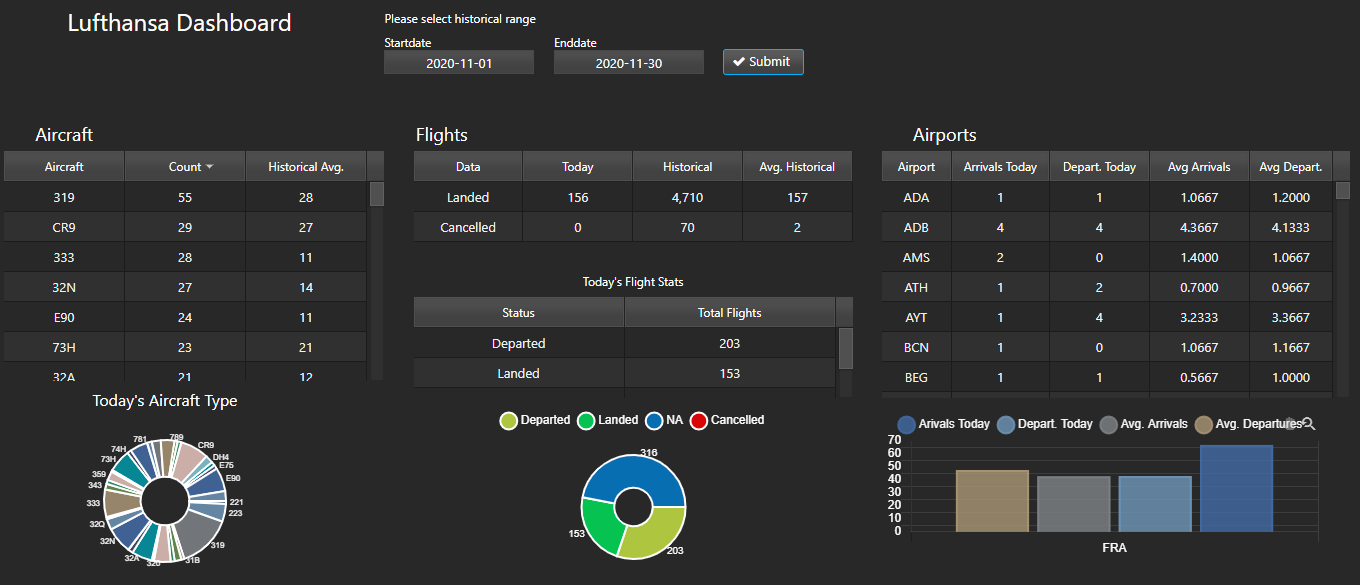
One can select a date range and see the variety of aircraft types which are deployed on a day to day basis. Clicking on an airport in the right hand table will dynamically alter the bar chart below showing the flight traffic for that day compared to the historical average for that period.
Interesting observations
Zipf’s law
Frankfurt airport alone makes up about 30{e673f69332cd905c29729b47ae3366d39dce868d0ab3fb1859a79a424737f2bd} of all Lufthansa travel. This trend continues with a small number of airports featuring in an outsized number of flights. Curiously this effect almost perfectly mirrors Zipf’s Law, as seen in the plot below:
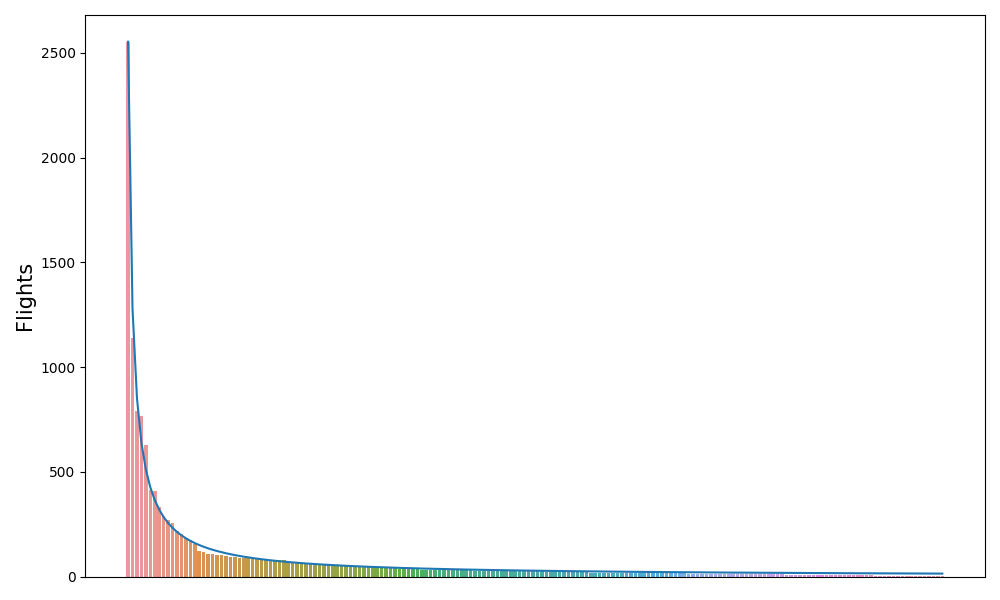
Unsurprisingly Lufthansa’s primary hubs, Munich and Frankfurt take the top two positions, with the top 10 being:
| 1 | Frankfurt | Germany |
| 2 | Munich | Germany |
| 3 | Vienna | Austria |
| 4 | Zurich | Switzerland |
| 6 | Düsseldorf International | Germany |
| 6 | Hamburg | Germany |
| 7 | Berlin Brandenburg | Germany |
| 8 | Izmir Adnan Menderes | Turkey |
| 9 | Brussels | Belgium |
| 10 | Antalya | Turkey |
What is rather surprising at first is the prevalence of flights to Turkish airports over the period we surveyed, given that Lufthansa typically operates most frequently in and around central Europe. As it turns out, Turkey is by far the most popular destination for German tourists outside Europe. Therefore it makes sense that Germany’s largest airline and its partners would operate heavily there.
Supply / demand variations
From the aircraft selected for each flight we can infer passenger volume and therefore trends and variations in supply and demand. For example, if we were to look at weekend flights between Munich and Frankfurt, we’d see that there is a huge variation in demand based on time of flight. The compact Embraer E90 (95 seats) takes the apparently unpopular early morning and late evening weekend slots, with the 200 seater 32Q pulling the slack on the mid-morning flights.
If we looked at the same route on weekdays however, we’d see those early morning flights using the Airbus A319 (~130 seats), indicating that passengers are more willing to endure early travel on weekdays, perhaps for business reasons.
Fleet variations
It’s worth noting that we also receive data on flights from Lufthansa’s rather large array of subsidiaries, as well as a few of their partner airlines. We received at least one flight from 51 different airlines and saw 58 distinct aircraft types during our observation period. This reveals the variety of aircraft Lufthansa use to serve their differing needs amongst their various companies. For reference EasyJet operates only 4 distinct aircraft types, all of which have a similar passenger capacity. This in turn may reflect a competitive advantage as Lufthansa can more efficiently provide flights on quieter routes, such as the aforementioned weekend spots.
Flight traffic
After collecting information across 8 days, we captured data from 7,000 flights. Extrapolating from Lufthansa’s November 2019 passenger flight data we should expect approximately 3,000 flights per day, or 24,000 flights over the time period that we measured. This represents an approximate 70{e673f69332cd905c29729b47ae3366d39dce868d0ab3fb1859a79a424737f2bd} decline in flight traffic, which is in-line with the figures presented in their third quarter interim report, and is attributable for the most part to the effects of the coronavirus pandemic since March.
Conclusion
Over the course of this post we’ve seen how we can use TorQ to pull data from an external data source and interface with Kx dashboards for real-time monitoring of multiple data sources. We’ve also shown how we can draw business insights from this data. We look forward to working with a diverse range of such data in the future.
Here at AquaQ we will continue to experiment with new technologies to further our expertise in data. If you’re interested in learning more about any of the technologies mentioned in this post, get in touch at info@aquaq.co.uk
Share this: