Data Intellect
Many application development lifecycles have moved to more modern cycle approaching full automation. The purpose of this blog is to demonstrate TorQ-Pipeline, an example using TorQ of a modern kdb+ CI/CD (Continuous Integration/Continuous Delivery/Deployment) pipeline.
Before DevOps culture, the software cycle was heavily siloed. The goal of CI/CD is to break down the barriers between the different teams involved in software development and lead to a more automated, and therefore smoother, deployment. In legacy systems, some level of manual intervention is required. Human beings are prone to error, by extension any pipeline which requires manual intervention is also prone to error. Automation removes this risk.
Continuous Integration
The goal of Continuous Integration is to merge code changes back into the main branch as quickly as possible. Of course, whenever we merge to master, we need to make sure that the new code is valid and this requires extensive testing. Automation of this testing is essential for a successful CI/CD pipeline. In many Continuous Integration pipelines, a CI tool is used to carry out these tests by creating a build with these new changes and validating the build against these tests.
Continuous Delivery/Deployment
The delivery stage occurs immediately after testing. Like everything in CI/CD, deployment must be automated aiming towards one-click or no-click delivery. After validation, the code can then be deployed to a specific environment e.g QA.
TorQ-Pipeline
The demonstration aspect of this blog is to show how a working kdb+ CI/CD pipeline can be established and for this we have used TorQ, AquaQ’s kdb+ framework, as an example. This included creating and running unit tests using the k4unit testing present already within TorQ. Each time a commit is made, our pipeline is ran against these unit tests. Passing this, the pipeline will then move to a QA stage, where the wider health of the TorQ stack is tested. This stage is in the form of the Quality Assurance Testing (QAT) process, an addition to the TorQ stack.
Architecture
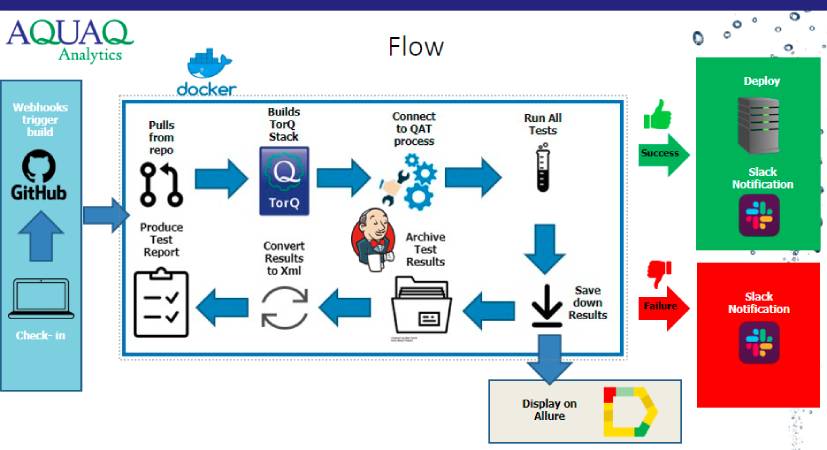
Source Code Management
We can break our pipeline into three stages. The first of these is the Source Code Management (SCM) stage. This stage is started whenever a developer commits a change to version control e.g GitHub. Once a change has been made and registered by GitHub, we move onto the next stage of the pipeline.
Build
The build stage of our pipeline is carried out by a Jenkins server contained within a Docker container. Docker is a tool that containerises applications in order to make them easier to use. Jenkins is a CI tool allowing us to automate a series of commands to create the build. We can see an example of a Jenkins dashboard below:
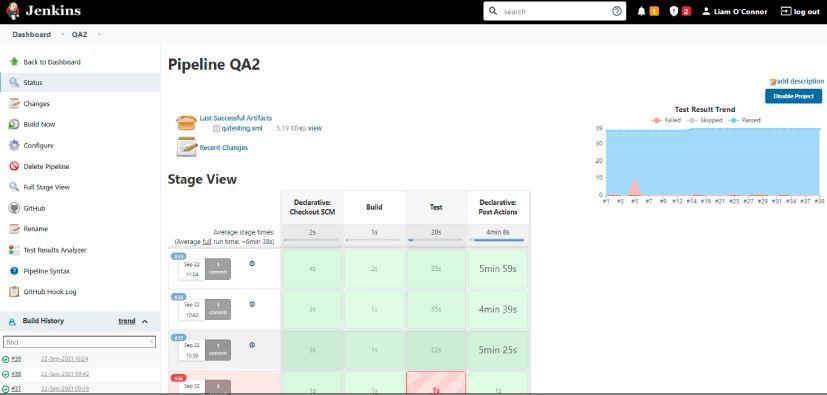
Within Jenkins, the unit tests are carried out, the results saved down and if successful, passed to the QA stage.
Test
Quality Assurance Testing (QAT) is an addition to the TorQ framework, allowing for a number of tests defined within the test suite contained in the tests/qat/ directory, to be ran against the TorQ stack in order to assess quality. The tests are in the form of seperate csvs which represent the different categories of tests. TorQ-Pipeline automatically connects to the QAT process whenever a build is created and runs all tests defined by using the tst.runall[`] command. More information on the functions involved in the QAT process can be found on the TorQ repo.
Each time we reach the testing stage of the pipeline and connect to the QAT process, results from the tests are saved down and archived. The test results are also converted into an xml format that is readable to Jenkins. We can use one of the plugins available to Jenkins, Test Results Analyser, to display these results in a more readable format. This highlights any passed tests in green and any failed tests in red. It also displays a history of test results from previous builds allowing us to see if a test is commonly failed.

Once test results have been generated and saved down, they are then available to be displayed in Allure. Allure provides simple visualisations of the test results and allows for easy trend analysis. Below you can see an Allure dashboard displaying statistics about our QA tests using archived data from previous builds:
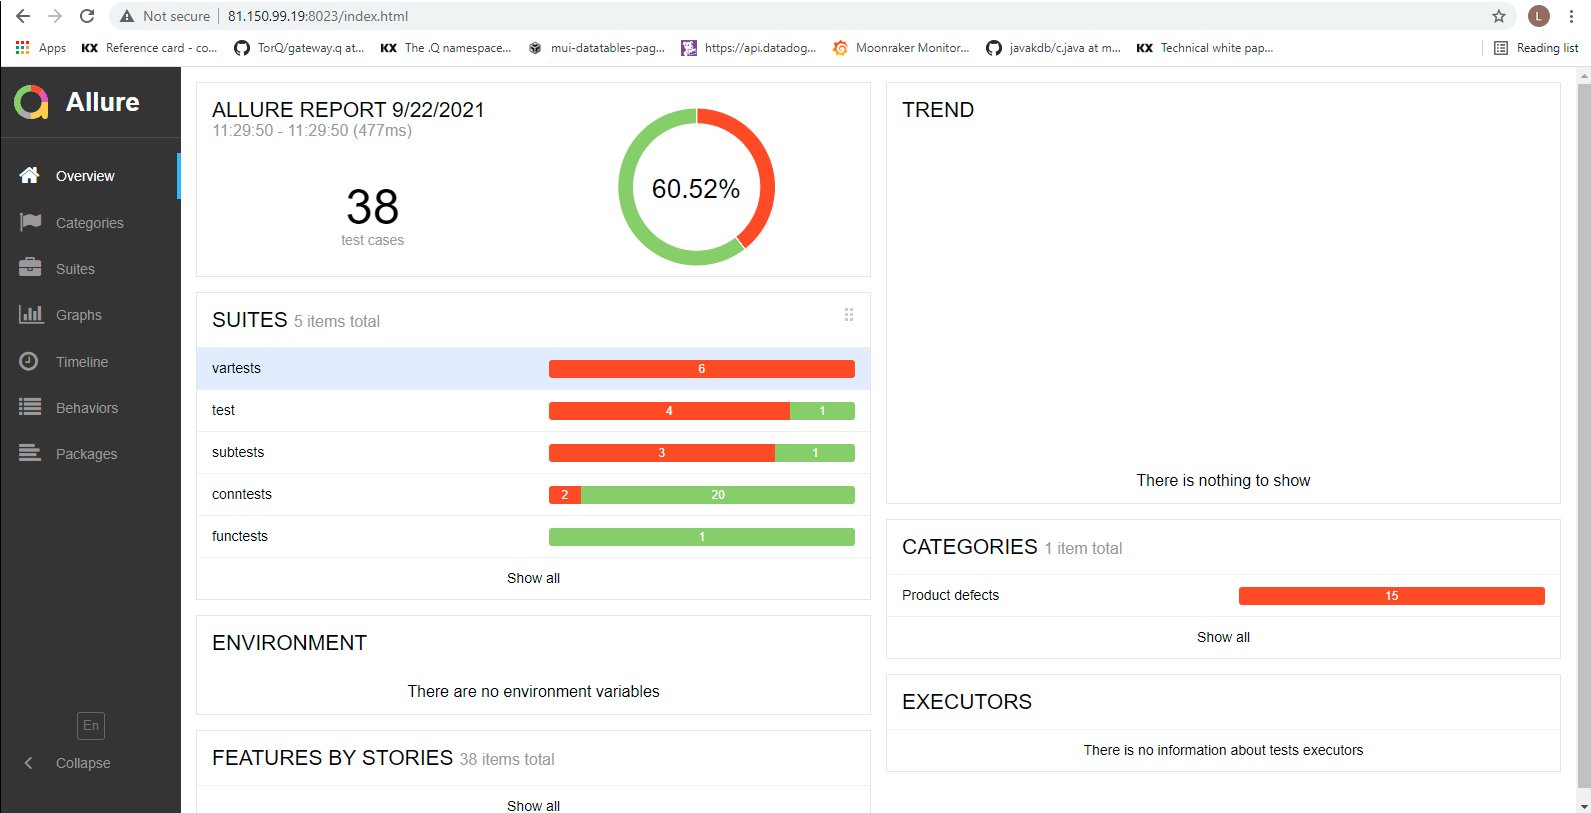
Allure provides information about each test containing a short description and a brief history of the result of each test:

Deploy
Every pipeline is different and CI/CD is very open-ended, extending indefinitely until automation is complete but for the TorQ-Pipeline project, we package our application and send it to a deployment directory via SCP. We have also included some version management to prevent anymore than 5 versions being stored in the directory at one time along with a soft link which points to the most recent version.
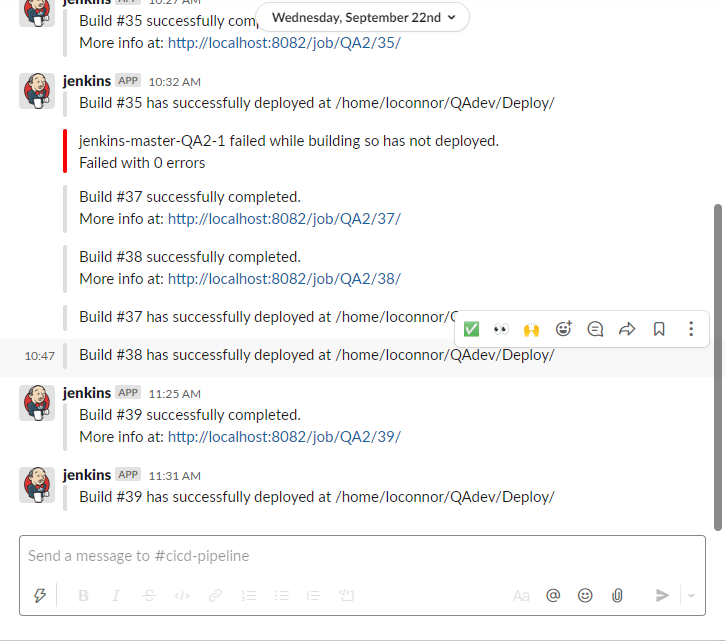
Jenkins also allows for integration with slack which allows the results of the build to be displayed in a slack notification including details on it’s deployment location if successful.
Conclusion
This blog has shown how we can create a modern CI/CD pipeline using TorQ and why it is relevant to today’s software development cycle. This project successfully integrated technologies such as Docker, Jenkins and Allure to create a working pipeline. We used these specific tools due to the fact that they are open-sourced and easily available although other technologies can be used to create a working pipeline. Additions were made to TorQ in order to make this possible including the creation of a QAT process to the base TorQ stack.
If you’re interested in learning more about CI/CD or want more information on kdb+ and TorQ, get in touch at info@aquaq.co.uk.
Share this: